Wednesday, 1 December 2010
Friday, 26 November 2010
Hi All,
First of all i would like to say that this isn't just a viral message that i've sent to my whole address book, but each person has been carefully selected as i feel you may be able to contribute in different ways.
So as many of you know I am fast approach the end of my time at Goldsmiths. My final year evaluation will consist of one project, which will be displayed at the Final Year Show.
As I’ve brainstormed ideas for this project, I’ve found myself becoming increasingly interested in how human beings interpret data and how the visualization of data can impact that interpretation. You will all have come across data visualization, either in newspapers or on the internet. It is often used to represent large amounts of data in order to aide the understanding of the data’s relevance and meaning. An example of Data Visualization can be found at the link below. This is a diagram of the Irish Bailout package and how various countries have contributed.
Have you clicked on the link? Good. My immediate observation was that although this diagram may be interesting and well conceived, it doesn’t provide you with any knowledge of how it impacts your personal situation. It doesn’t enable the reader to emotionally engage with the topic at hand.
For my project I would like to visualize data that is local and very personal. Elements of every day life that, although not life changing, impact the way you go about your day. Relationships such as how many adverts you pass on the way to the supermarket and how they impact your buying behavior OR maybe something more personal such as what you eat in the evening and what time you poo in the morning.
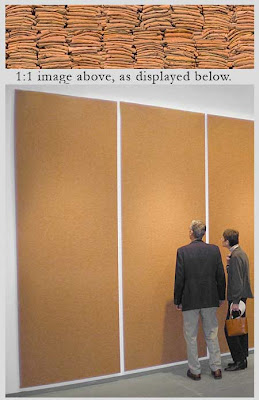
Last week I produced a piece of Data Visualization to represent the number of people that displayed work in accordance with a deadline. I wanted the graphic to represent the class at the very moment of being viewed, meaning the data would be live and therefore more emotionally engaging for the students. I also chose to use a rather strange way of displaying the data, and as, I really did not know the results until the deadline had passed, I had to create 20 different versions to ensure that the correct one would be available. (please see attached image).
Now to the important part! I would like to ask for your help. More specifically I’d like you to task me to collect some form of data about your life. Have you ever wanted to find something out, but would never have the time to actually do it. Well this is your chance to ask me to do it for you.
I would design the process of collecting the information and then go about vizualisation the data. The possibilities for the end product are ENDLESS. It could be a 2D graphic, a 3D kinetic sculpture or even a piece of interactive software.
So please send your ideas to me and I can get to work selecting those I could best work with. I understand if your too busy to respond or cant think of anything for the time being.
I hope you are all well.
Love Danny. x
Thursday, 28 October 2010
Thursday, 14 October 2010

So the other day i spent an afternoon riding the bus, my aim was to count the number of white people riding the 21 bus from New Cross Gate to Old Street compared to the black people.
Tuesday, 12 October 2010
Monday, 11 October 2010
So this is a video I watched a little while ago, i found it allot more interesting when i first watched it then now.
Today in college we did our first workshop on our ideas for our projects. I talked about how i wanted to base my project on different ways of understanding data. I think it would be fascinating to transform data in to a form that is easier for visually impaired people to read. Maybe something physical that can be touched or heard.
I read an article today about how blind people precept beauty and how even tho they cant appreciate somebodies appearance, they still ask their friends if the person is good looking before considering dating them. One girl explained that "beauty to her is when you can experience something with all senses." So even tho this lady had lost her sight, her appreciation for an attribute only recognised with something she didn't have, is still really important to her.
The article was from a beglian magazine called THE WORD. Find the article on their online magazine by clicking here, its on page 65.
So after a good day of research and thinking about possible paths to take my project, i've decided to change it a little.
I now think that i would like to base my project on unusual links between two completely different types of information or data.
I posted about this earlier on, but i think it would be fascinating to find really awkward correlations between two completely abstract pieces of data. I also fancy adding a bit of humour to the project... Im working on it!


